











Earlier this year, we introduced Science Exchange Assistant, our conversational AI experience designed to help users navigate work more efficiently across the Science Exchange platform.
We're expanding Science Exchange Assistant with conversational analytics capabilities that allow users to ask questions about their Science Exchange data in plain language and receive immediate answers, all without searching through dashboards, applying filters, or building reports.
Ever had a question you couldn't easily answer without digging through dashboards or manipulating pivot tables? Now you don't have to. Just ask. The data generated through outsourced R&D activities should be as accessible as the workflows themselves. It's a simple idea with significant implications: the data generated through outsourced R&D activities should be as accessible as the workflows themselves.
Why dig through dashboards for an answer when you can just ask? Conversational analytics is closing the gap between a question and an answer.The Challenge with Operational Data
Modern R&D organizations generate vast amounts of operational data and usually have lots of questions they want to ask of that data: How much are we spending with a particular supplier? Which categories are growing year over year? How long does it take to receive a quote? Which departments are driving the most activity?
While the answers may exist, finding them often requires knowing where to look. For many organizations, operational intelligence is locked behind dashboards, reporting tools, and specialized analytics expertise. Users must know which report contains the information they need, understand the underlying data model, and apply the correct filters to arrive at an answer.
That process creates friction between a question and the insight needed to act on it.
We believe there is a better way.
Ask My Data Questions
With conversational analytics built directly into Science Exchange Assistant, users can ask questions the same way they would ask a colleague.
Instead of navigating to a reporting tool, users can simply type:
- "What are our top three suppliers by spend?"
- "How many requests have we submitted with Supplier X this year?"
- "What is our average approval time?"
- "Which site had the largest increase in active users?"
The assistant interprets the question, queries the appropriate data model, and returns the answer directly within the conversation. The result is a faster, more intuitive way to access the operational data already structured and stored within Science Exchange.
Conversational analytics isn't about replacing business intelligence platforms. Dashboards and reports remain essential for deep analysis, trend exploration, data exports, and organization-wide reporting. However, many of the questions users ask every day require a quick answer. By bringing analytics into a conversational interface, we're reducing the distance between curiosity and insight.
What Users Can Explore Today
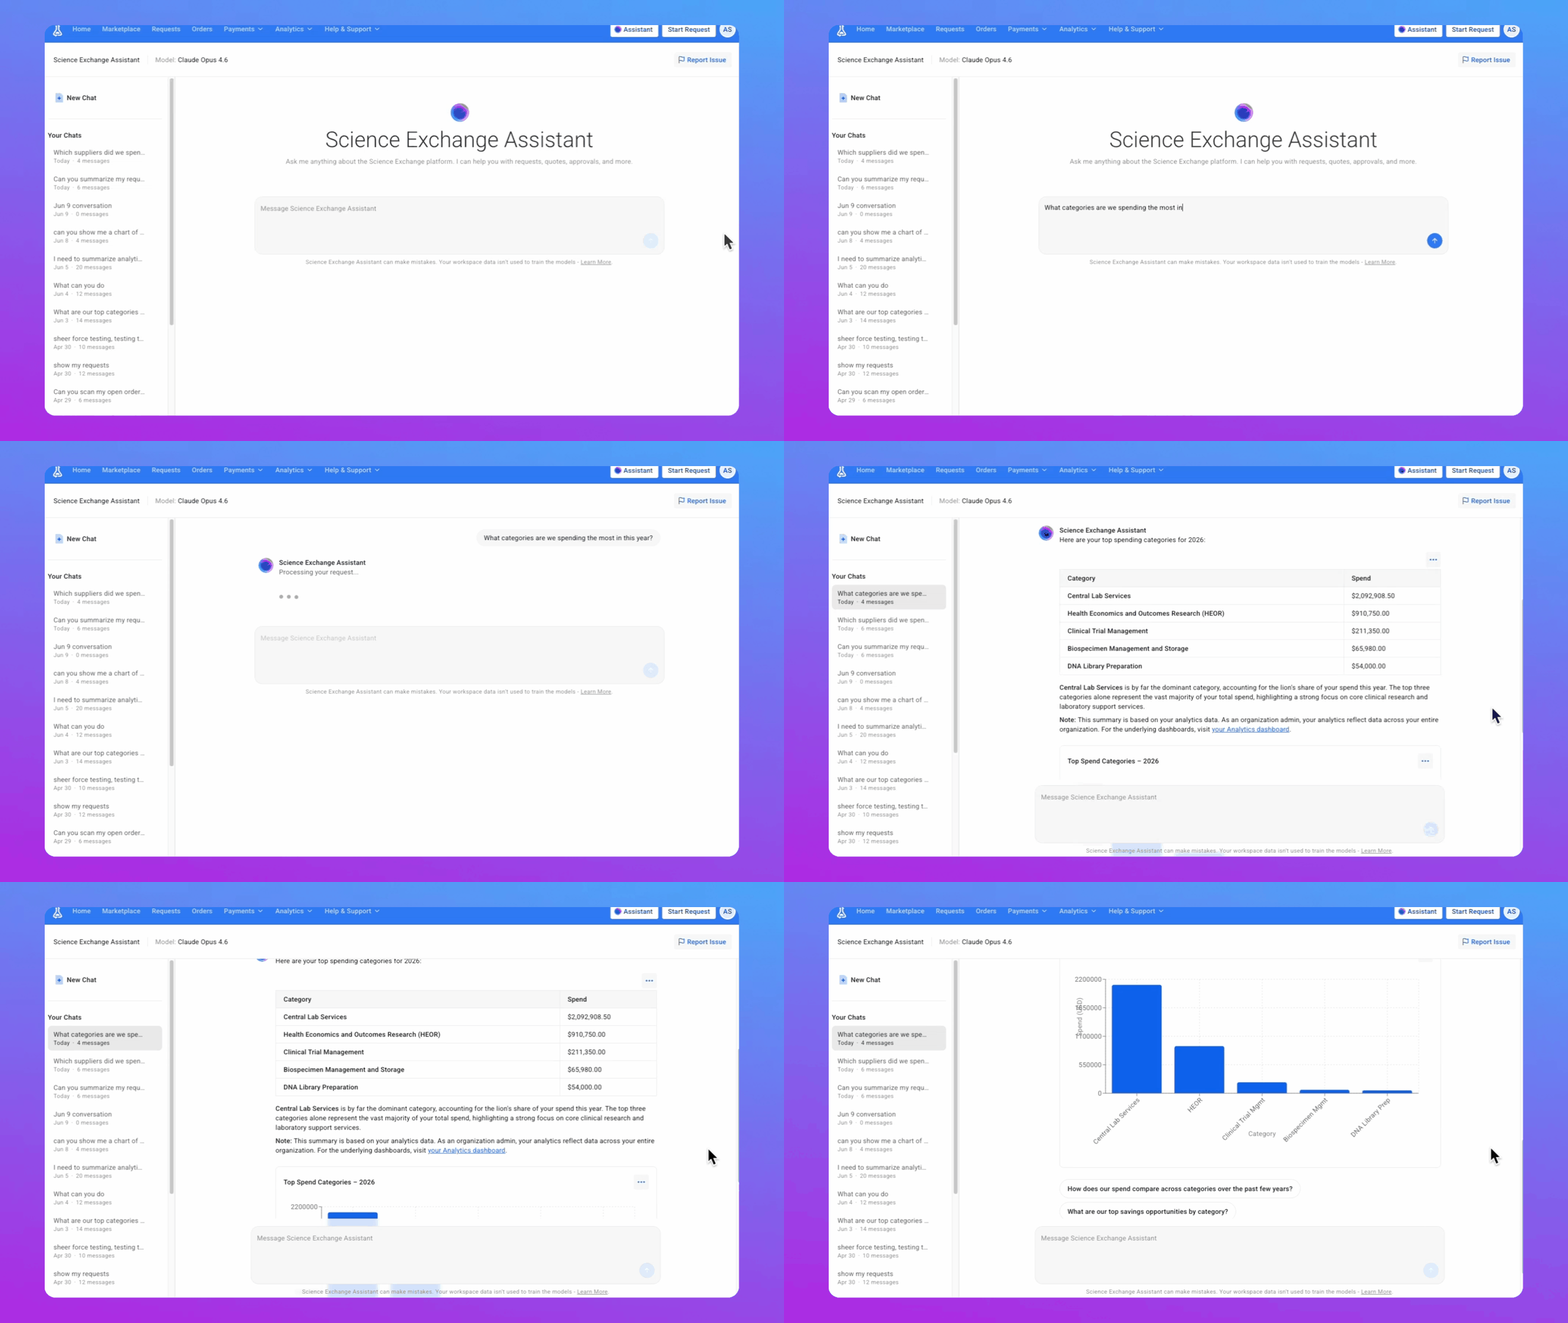
The new capability enables users to explore a broad range of operational and procurement intelligence directly through Science Exchange Assistant, including:
Spend & Supplier Analytics
Analyze supplier spend, compare spending across time periods, identify top suppliers, and drill into the activity driving those results.
Example questions:
- "What are our top three suppliers by spend this year?"
- "How much did we spend with Supplier X in 2025 compared to 2024?"
- "Which requests make up that spend?"
Request & Workflow Metrics
Go beyond standard reporting to uncover patterns in request volumes, approval bottlenecks, and workflow performance — including trend analysis that traditional dashboards can't surface on their own.
Example questions:
- "How many orders from 2025 are still open?"
- "How many requests went through competitive bidding last quarter, and how does that compare to the same period last year?"
- "Which workflows are taking the longest to complete, and where are approvals getting stuck?"
- "How has our average quote turnaround time trended over the past six months?"
Category Insights
Track spending patterns by category, identify growth trends, and understand where investment is concentrated.
Example questions:
- "What is our highest-spend category?"
- "Which categories have increased or decreased year over year?"
- "Which site is spending the most on genomics services?"
User Adoption & Platform Utilization
Explore login activity, request creation trends, and adoption patterns across teams and sites.
Example questions:
- "Which site saw the largest increase in active users this year?"
- "Who submits the most requests?"
- "Which users log into the platform most frequently?"
These capabilities are powered by Science Exchange's analytics infrastructure, allowing users to access trusted operational data through a natural language experience rather than a traditional reporting interface.
Part of a Larger Vision
At Science Exchange, we believe the future of R&D operations is enabled by intelligence.
The first generation of software helped organizations move away from spreadsheets and manual processes. The next generation will help teams understand, interpret, and act on the data generated by those processes.
Science Exchange Assistant is an important step toward that future. By combining workflow intelligence, platform knowledge, and operational analytics within a single conversational experience, we're making it easier for teams to access the information they need, when they need it. The goal is creating an intelligent infrastructure for science, one where insights are no longer hidden behind reports and dashboards, but available through a simple conversation.
We're excited about what this unlocks today, and even more excited about where it leads next.