


Every biopharma R&D organization is paying it. Here's how to calculate yours — and what it's actually costing you.
There's a reason the Discovery Tax has gone largely unaddressed in biopharma R&D: it doesn't show up anywhere obvious. You won't find a line item for "process friction" or "procurement delays." No board deck calls out the cost of manual workflows. But the cost is very real. And more importantly, it compounds.
In our last article, we explored how Eroom's Law reflects this growing, invisible burden across the industry. But this isn't just a macro problem. It's happening inside your organization, every day.
Recognizing that the Discovery Tax exists is the first step. Understanding what it's costing you is where it becomes actionable.
Most biopharma organizations are losing $5M–$8M a year to process friction they can't see — here's how to calculate yours.Where Discovery Tax Shows Up
The Discovery Tax isn't one thing. It's the accumulation of friction across your R&D operations and it tends to concentrate in three places.
1. Scientist Time Spent on Non-Scientific Work
Highly trained scientists are routinely pulled into operational tasks like tracking down suppliers, navigating approvals, re-entering data, and following up on procurement status. Individually, these tasks feel small and manageable. Collectively, they add up to a meaningful loss of scientific capacity.
On average, scientists lose about five weeks per year to this kind of overhead. At a fully loaded cost of $150K–$200K, that translates to roughly $14K–$19K of lost capacity per scientist each year. Across a team of 100 scientists, that's $1.4M–$1.9M—not from failed experiments, but from time that was never spent on science in the first place.
2. Delays in Study Start
When a study is ready to start but gets held up—because a supplier hasn't been onboarded, a purchase order is stuck in approvals, or an intake form is incomplete—the impact goes far beyond administrative inconvenience. Programs slip, timelines compress, and teams lose momentum at critical moments.
Roughly 30% of externally managed studies experience procurement-related delays, typically in the range of three to six weeks. That translates to about 4% of external R&D spend lost to rework, re-scoping, and timeline inefficiencies. On a $50M external R&D budget, that's approximately $2M per year tied directly to delays.
3. Lack of Visibility into Spend
When external R&D spend is managed across email, spreadsheets, and disconnected systems, visibility breaks down. That's when leakage occurs. Duplicate vendors, mismatched invoices, and off-contract spend quietly erode budgets.
This category is often underestimated because it's diffuse, but the data is consistent: 6–8% of unmanaged spend is typically lost this way. For a $50M budget, that's another $3M–$4M annually that organizations are effectively leaving on the table.
Your Discovery Tax formula
When you bring these components together, the Discovery Tax becomes measurable:
Discovery Tax = Scientist time + Delay costs + Spend leakage
For a mid-sized biopharma organization with 100 scientists and $50M in external R&D spend, that typically adds up to $5M–$8M per year. Importantly, this isn't edge-case inefficiency. It's the baseline for how most organizations operate today.
| Component | What's being measured | Benchmark |
|---|---|---|
| Scientist time on admin | 5 weeks/scientist/yr × fully-loaded cost | $14K–$19K per person at $150K–$200K cost |
| Procurement delay cost | ~30% of studies delayed × 4% of external spend | ~$2M on a $50M external R&D budget |
| Spend leakage | ~6% of unmanaged external spend | ~$3M on a $50M external R&D budget |
Calculate your organization's discovery tax
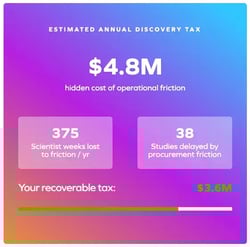
We built an interactive Discovery Tax Calculator so you can personalize these estimates for your organization. Adjust for your team size, scientist cost, external spend, and number of active programs — and see your estimated tax in real time, broken down by each component.
The calculator also shows your estimated "recoverable tax" — the portion of that cost that can realistically be addressed through better R&D operations infrastructure. Based on Science Exchange customer outcomes, that figure typically represents 75% of the total Discovery Tax, recoverable within 12–18 months of platform adoption.
What this means for you
Once you quantify the Discovery Tax, the conversation shifts. It's no longer about general efficiency improvements or incremental process changes; it becomes a question of recoverable value and strategic impact.
We built the Discovery Tax Calculator to make this tangible, allowing you to model your own organization based on team size, external spend, and program volume. But the most important output is what portion of that number is actually recoverable.
75% of biopharma's hidden R&D tax is recoverable — but first you have to know what you're paying.Across Science Exchange customers, approximately 75% of the Discovery Tax can be addressed within 12–18 months. That recovery doesn't come from working harder or adding more process layers; it comes from fixing the underlying operational infrastructure.
Organizations that successfully reduce their Discovery Tax don't just optimize around the edges. They fundamentally change how R&D operations function, and the results show up in consistent ways.
Scientists regain time not by changing how they work, but by removing tasks that never should have been theirs. Programs move faster, as procurement and supplier workflows no longer create bottlenecks at the start of studies. And perhaps most importantly, spend becomes more intentional, with clear visibility into where dollars are going and where they can be better allocated.
75% of your Discovery Tax is recoverable with the right capabilities
The tax is optional
Most taxes feel inevitable. This one isn't.
The Discovery Tax persists because of how R&D operations are structured today: fragmented systems, manual workflows, and disconnected supplier ecosystems. That also means it can be reduced, and in many cases largely eliminated, through deliberate investment in the infrastructure that connects scientific intent to execution.
In our final article, we'll look at what leading biopharma organizations are doing differently and how they're turning R&D operations into a strategic advantage. For now, the starting point is simple: know your number.
For now: run the numbers. Know your tax. The first step to eliminating it is understanding what you're paying.
Continue the Series
Next: Blog 4 — What do the leading biopharma organizations do differently? We'll look inside the R&D operations of the organizations bending the Eroom's Law curve — and what they have in common.
Paired Interactive Tool
This article pairs with the Discovery Tax Calculator — an interactive web tool that lets R&D leaders calculate their own organization's Discovery Tax in real time. Adjust for team size, external spend, and number of active programs to generate a personalized estimate across all three friction components.
The Discovery Tax Series:
-
Blog 1 — Friction
-
Blog 2 — Eroom's Law
-
Blog 3 — The Calculator (this article)
-
Blog 4 — What leading orgs do differently (coming soon)